Click to visit EOI’s State of Washington Budget visualization
Need to fact-check someone during a Facebook debate, or just prep for an intense upcoming round of pub trivia? EOI has you covered.
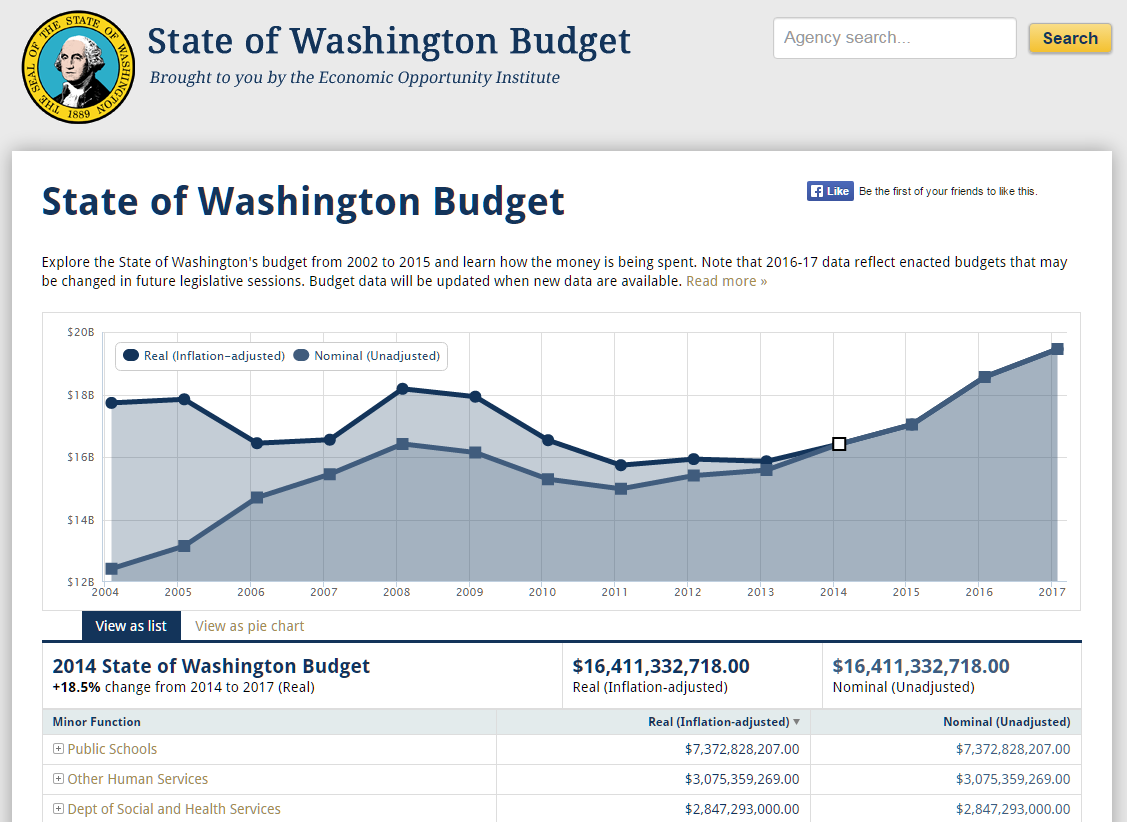
EOI’s State of Washington Budget visualization let’s you see budget trends as far back as 2004 and as far ahead as 2017, on a scale as broad as the state’s overall budget or as specific as an individual department within an agency.
All charts and tables display both “real” (inflation-adjusted) budget numbers calculated by the Economic Opportunity Institute, alongside “nominal” (non-inflation adjusted) numbers provided by the Washington State Office of Fiscal Management.
Enjoy!
More To Read
April 17, 2024
2023-24 Impact and Gratitude Report
Reflecting on a year of progress and transition at Economic Opportunity Institute
April 12, 2024
Welcoming our New Executive Director, Rian Watt!
EOI is excited to begin its next chapter under new leadership
April 4, 2024
Is There a Valid Argument Against Cost-Free College in Washington?
Cost-free college is a meaningful investment that would change lives. What's stopping Washington from making it happen?