Some media outlets have taken to calling our current economic woes “The Great Recession.” Anytime people lose their jobs and businesses close, it causes family and community hardship — recession or not. But how does this recession really stack up against others in recent memory?
To shed some light on that question, following are “apples-to-apples” comparisons of job loss and unemployment during previous and current recessions in Washington State.
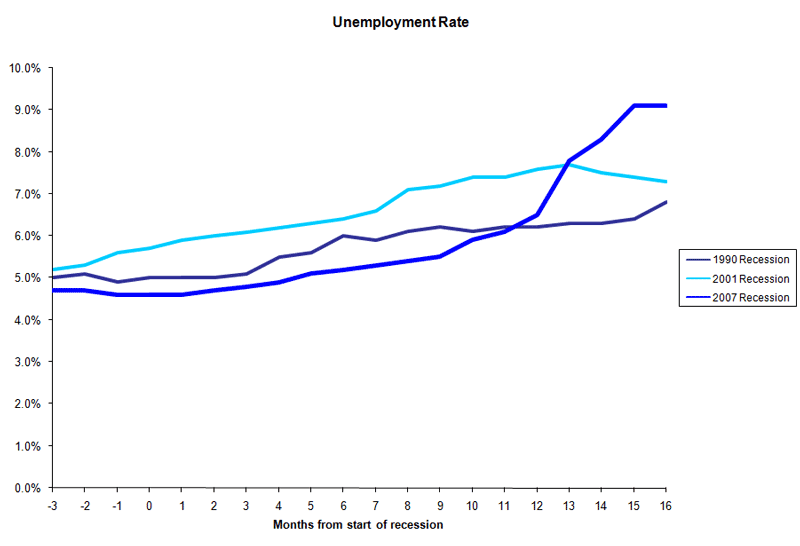
The first chart shows Washington’s unemployment rate during the 1990, 2001 and 2007 recessions, starting three months before each recession began (“-3”) and continuing through the 16 months following (through April 2009 of this year):
 The second chart covers the same time period, but indexes job loss to 1 to allow for comparison across recessions. The beginning of recession is set as the standard: 100% employment, and every other month is then expressed as the percent of employment in relation to that base month.

(Data courtesy of the Economic Policy Institute.)
More To Read
April 17, 2024
2023-24 Impact and Gratitude Report
Reflecting on a year of progress and transition at Economic Opportunity Institute
April 12, 2024
Welcoming our New Executive Director, Rian Watt!
EOI is excited to begin its next chapter under new leadership
April 4, 2024
Is There a Valid Argument Against Cost-Free College in Washington?
Cost-free college is a meaningful investment that would change lives. What's stopping Washington from making it happen?